Ask any engineering manager who their best engineer is. The answer comes back before you have finished the question, with no hesitation and no “let me check something first.” They know. They have always known.
Now ask them to show the work.
You will get a story. A good story, usually, about an incident somebody handled at 2am, or a refactor that unblocked a quarter. What you will not get is a number, a comparison, or any account of the four engineers whose work the manager was not in the room for. That confidence is built out of recall, and recall is a function of proximity.
Here is the thesis. Engineering performance is judged from memory, memory rewards visibility rather than value, and the work you actually want people to do is written down in a roadmap that is never connected to the thing you rate them on. Those two documents have nothing to do with each other at almost every company I have seen, including mine.
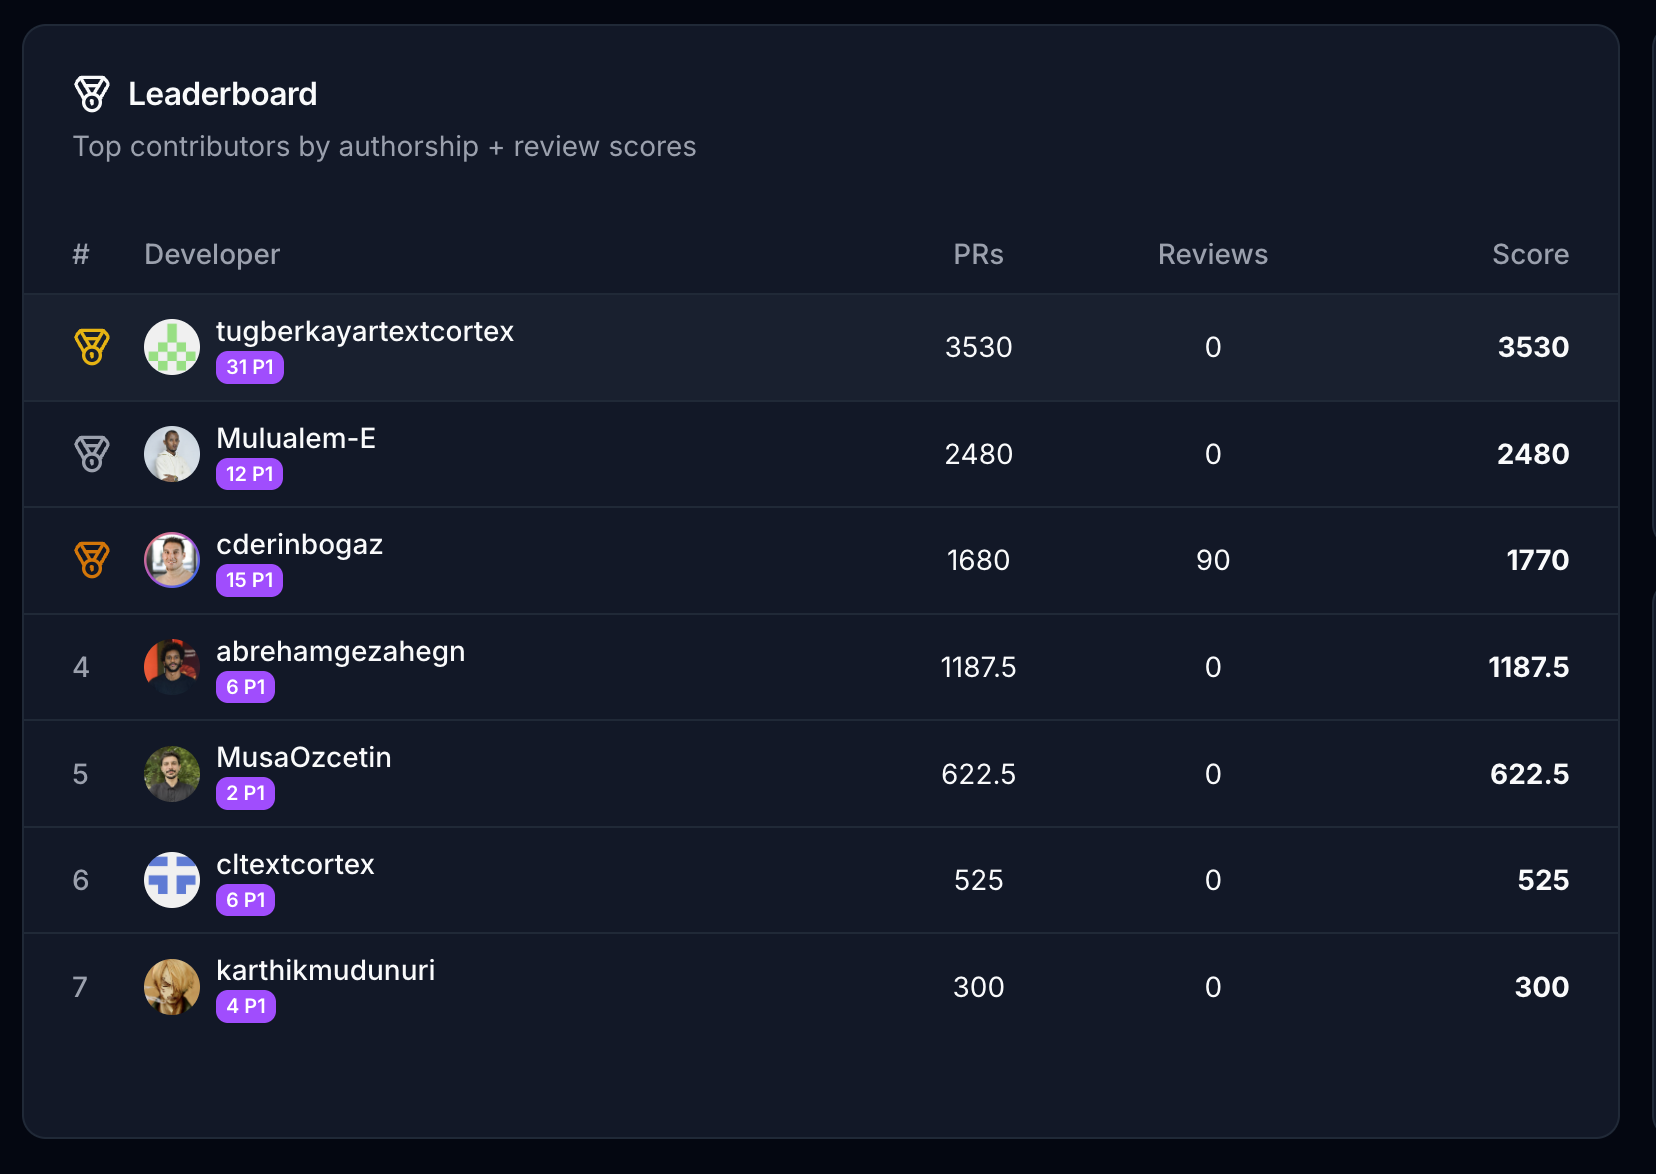
So we connected them. Every merged pull request gets read by a model, assigned a severity, and multiplied by how much our roadmap cares about the component it touched. The result is a monthly leaderboard, and it feeds bonus decisions. Here is ours.
The received wisdom is that this cannot be measured, and the received wisdom is a shrug
The standard position on measuring individual output is that you must not, because every proxy is a trap. Lines of code rewards bloat. Commit count rewards splitting. Tickets closed rewards whoever grabs the small ones first. Story points are a negotiation held before the work starts. Even the good frameworks are deliberately team-level: DORA measures four things about a delivery pipeline and says nothing about people, which its authors are explicit about.
All of that is correct, and none of it is an answer. The ranking happens anyway, every year, at compensation time, in a room, from memory, weighted by who the person in that room sat next to. Refusing to measure buys you a ranking with no audit trail and no appeal.
Call it the loud engineer premium: the gap between how well you are rated and how well you performed, explained entirely by your distance from whoever writes your review. Ask any human to compare fifteen people’s technical contributions across a year using nothing but what they happened to notice and this is what comes out. Any of us would produce it.
That premium was unavoidable until about two years ago, because the raw material for a better answer was a pile of diffs nobody had time to read. That constraint is gone. A model can read every diff in your repository every month for less than the cost of the meeting where you currently guess. Reading them is the easy part. Deciding what the reading is worth is the whole problem, and that is not a technical question.
The entire formula fits on one line
Here it is, in full, from the scoring path in GitRank:
final_score = is_eligible ? severity_base_points × component_multiplier : 0I have not simplified that for the blog. It is the line as it runs, with no hidden regression, no learned weighting, no reputation term and no tenure adjustment. Severity times importance, or zero.
Severity is a fixed ladder, set once and visible to everyone being scored.
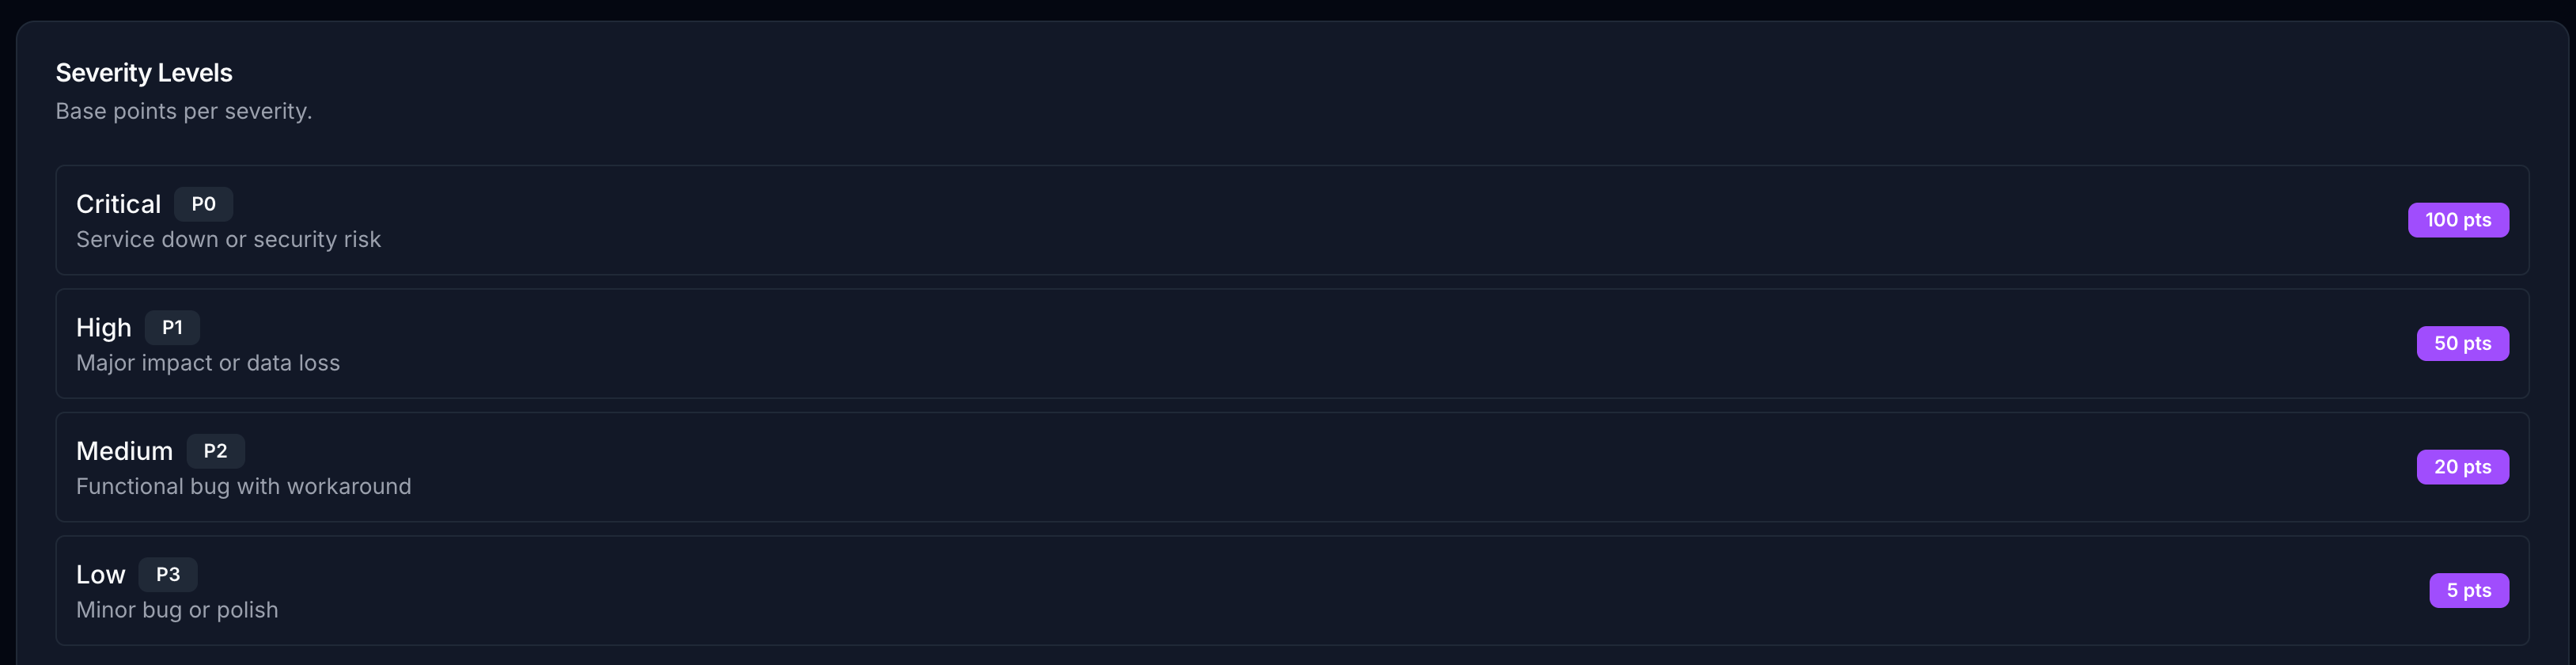
A critical fix is worth twenty low-priority ones. That ratio is a policy statement, and we wrote it down instead of leaving it in somebody’s head.
Importance is the half that matters. Every component carries a multiplier, and the multiplier is whatever the product needs this quarter.
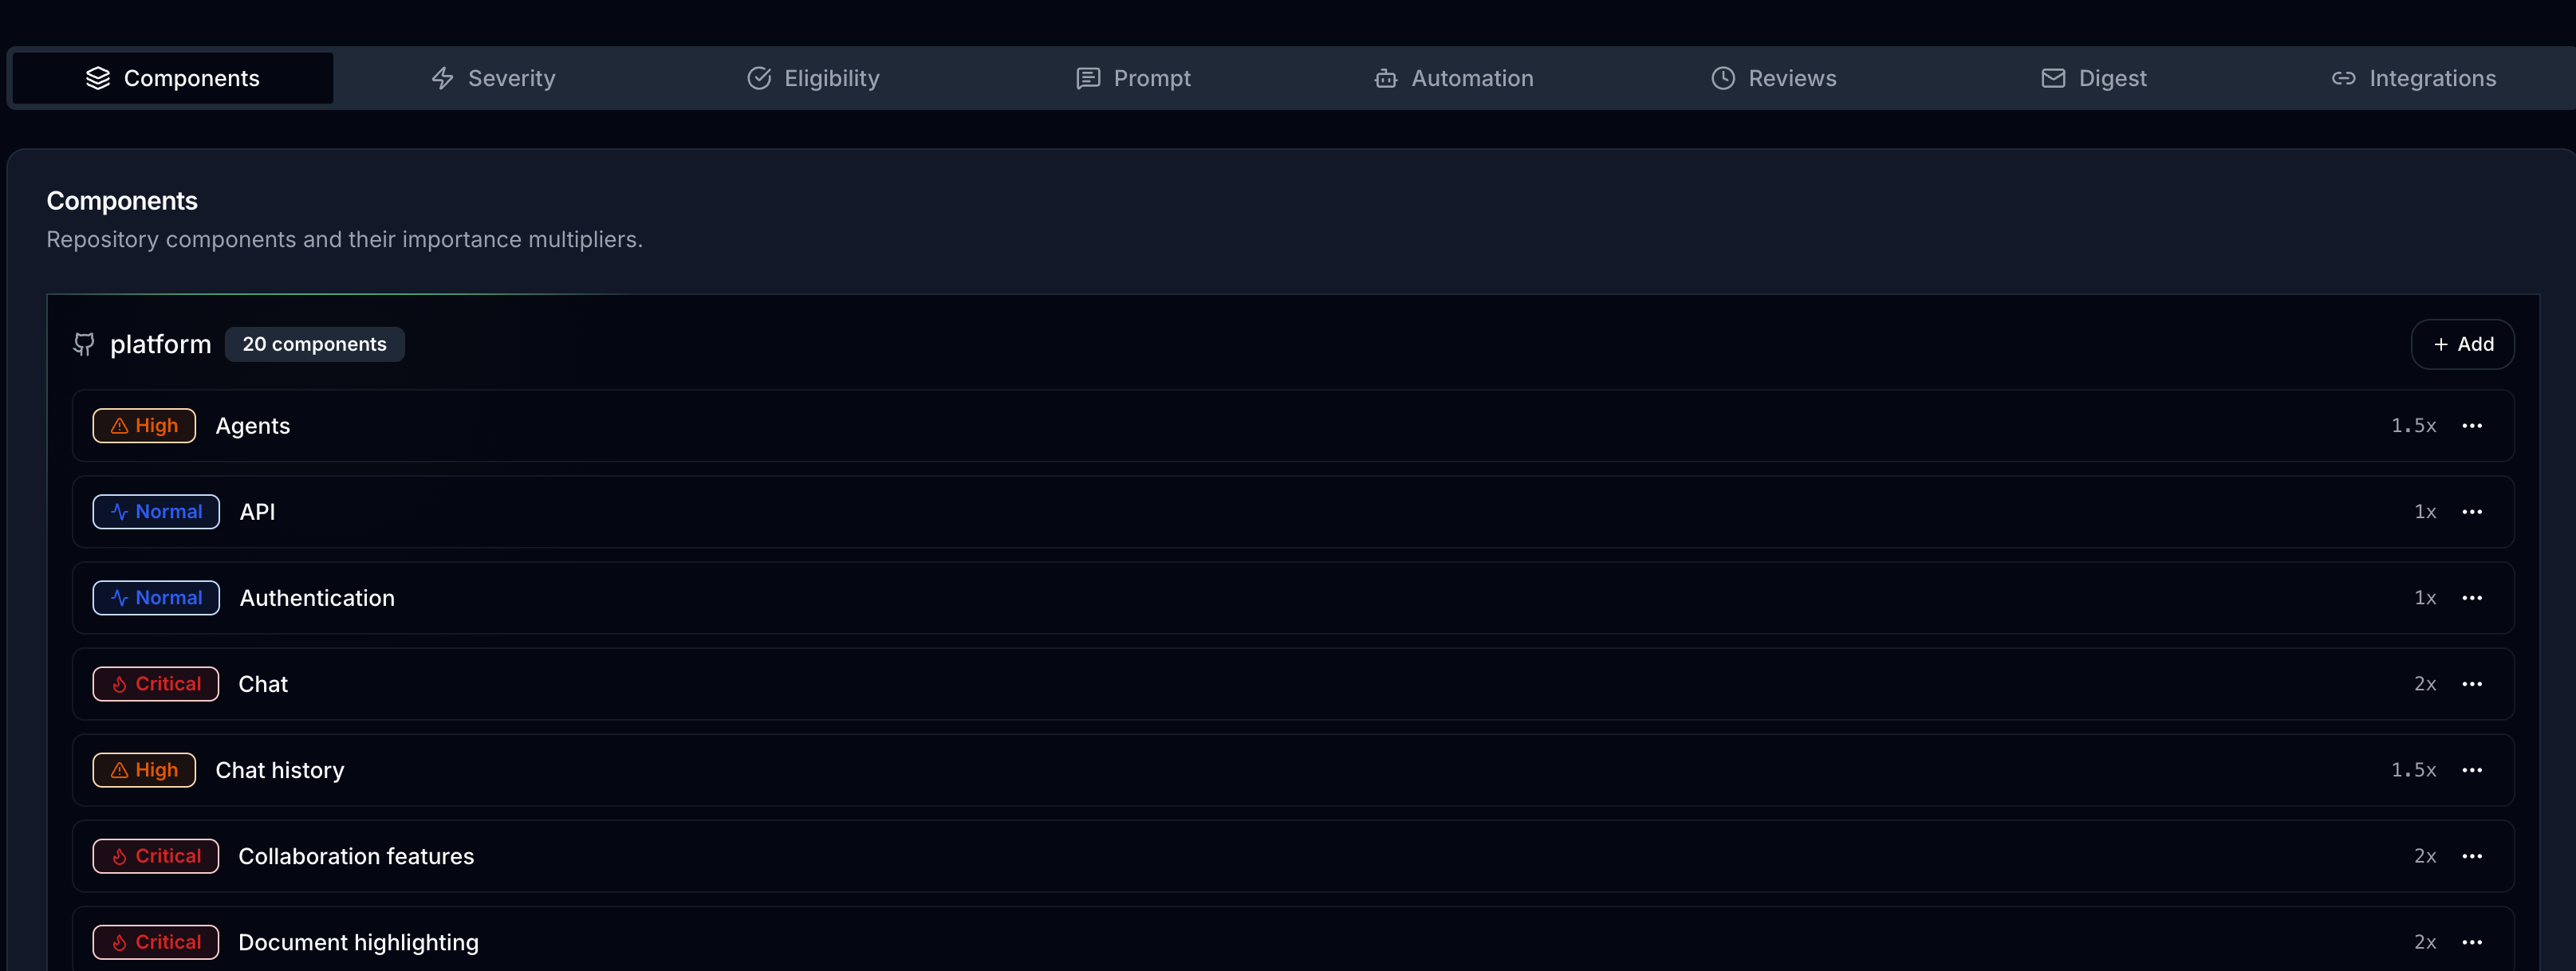
Chat is 2.0x because chat is what we are betting the product on. Authentication is 1.0x because it works and we would like it to keep working quietly. Those are product decisions, and the multiplier table is where they get retyped into a field that pays.
The strategy document and the compensation input became the same document. That is the move. The model is plumbing and the leaderboard is a rendering of it, and if the roadmap changes in October then the incentive changes in October, rather than at a review cycle fourteen months out.
Let me spell this out, because it is the part people skip. Forty smart people, each optimising locally and honestly, will produce a quarter of work that does not add up to the thing the company said it wanted. Nobody in that picture is lazy, which is what makes it hard. Middle management exists largely to fix it, carrying strategy around in conversation one desk at a time, losing fidelity at every hop. A multiplier table does the same routing in one hop, and in October it still says exactly what you typed into it in January.
Joi Ito already named the difference. One of the nine principles in Whiplash, written with Jeff Howe in 2016, is pull over push: you pull from the network as you need it rather than keep everything in stock. Ito was describing resources. Direction behaves the same way. A push organisation stockpiles the strategy in a management layer and hands it out in conversation, which is why it reaches the edge of the company late and lossy. A pull organisation publishes the strategy as a price list and lets people take what they need from it. The multiplier table is the price list.
A critical fix in chat is worth forty polish commits in the API
Run the two halves together and the spread is severe. A P0 in chat scores 100 base times 2.0, so 200 points. A P3 in the API scores 5. Forty to one, which is the gap between the most valuable pull request you can merge here and the least.
That ratio is deliberately violent, and it does what gentle incentives never manage. Nobody reorganises their week around a 15% difference. People absolutely reorganise their week around a 40x one.
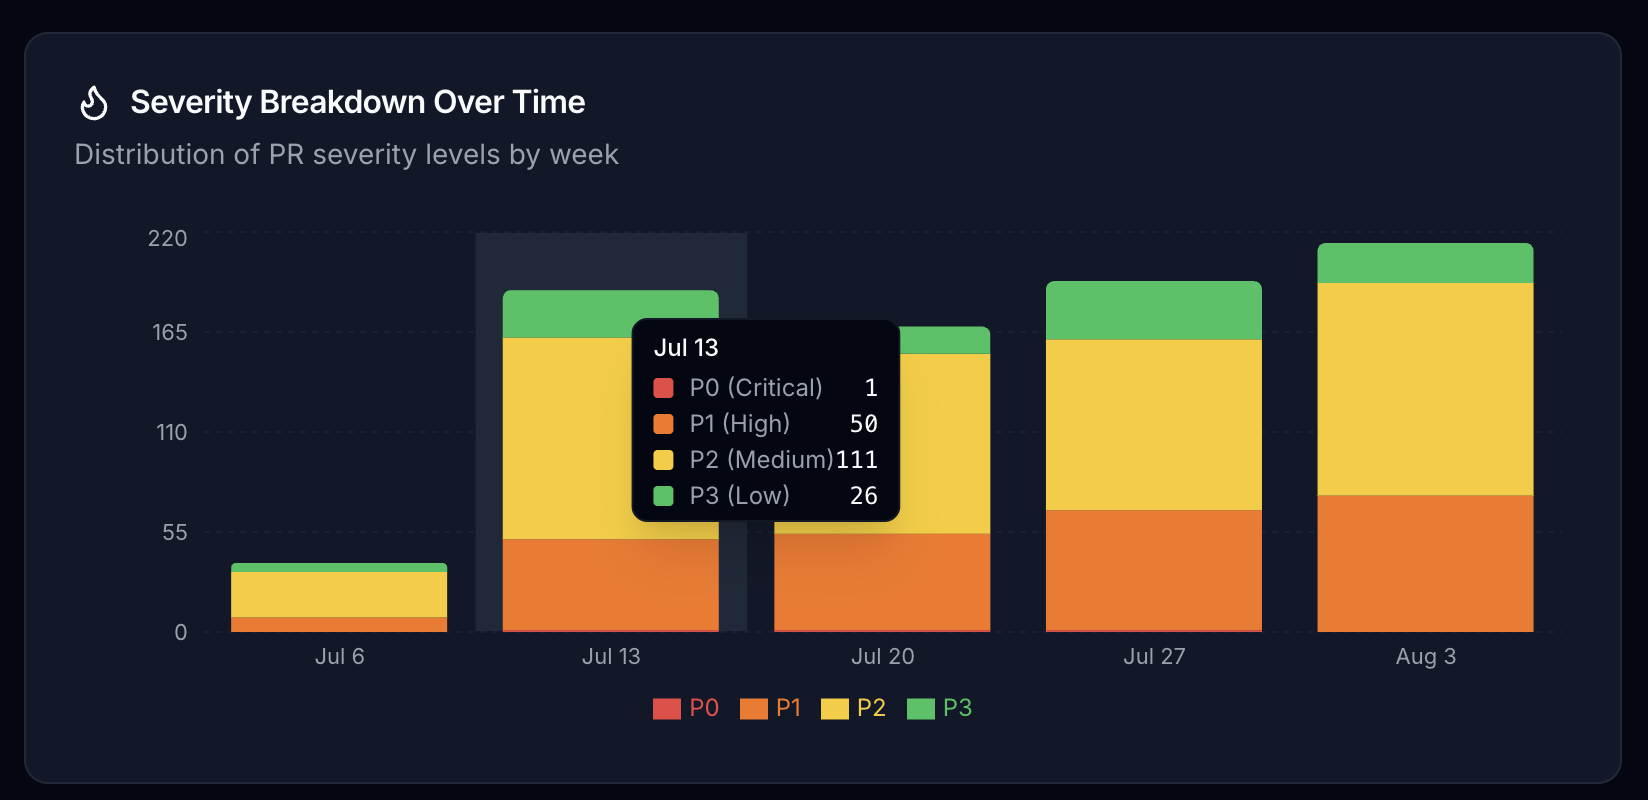
188 pull requests in a single week. P2 is 59% of them, which is what a normal engineering week looks like everywhere. Now weight it. Those 111 P2s are worth 2,220 points. The 50 P1s are worth 2,500. Fewer than half as many pull requests carry more than half the value of the week. Count pull requests and you conclude the week was about P2s. Weight them and the week was about fifty specific pieces of work, and you can name who did them.
Two people were 58% of the output, and I had the order wrong
Seven developers, 10,415 points. The top developer holds 3,530 of them, 33.9% of everything the team produced by value. The top two hold 57.7% between them.
Concentration like that usually means the top two are working on the highest-multiplier components, which is exactly what we asked them to do. The number describes where value is landing, and I would read nothing into it about the other five.
The ordering is what broke my prediction.

Mulualem-E is the primary expert on chat, our 2.0x component, with 71 of its 230 pull requests, and on agents, our 1.5x component, with 86 of 148. If you had described that to me and asked who tops the leaderboard, I would have said him without pausing. He is second. The top spot goes to tugberkayartextcortex, with 31 P1 pull requests against Mulualem-E’s 12.
Severity mix beat component ownership. Owning the most important area of the product turns out not to be the same thing as repeatedly landing high-impact work inside it, and until we published this I could not have told you which of the two our compensation was rewarding. It was rewarding whichever one I happened to have noticed. That is the loud engineer premium, caught in my own company. My intuition had the right two people and the wrong order, and the wrong order is what a bonus is.
Payments is 45% bug fixes and nobody had to argue about it
Scoring every pull request also ends the habit of arguing about quality from anecdote.
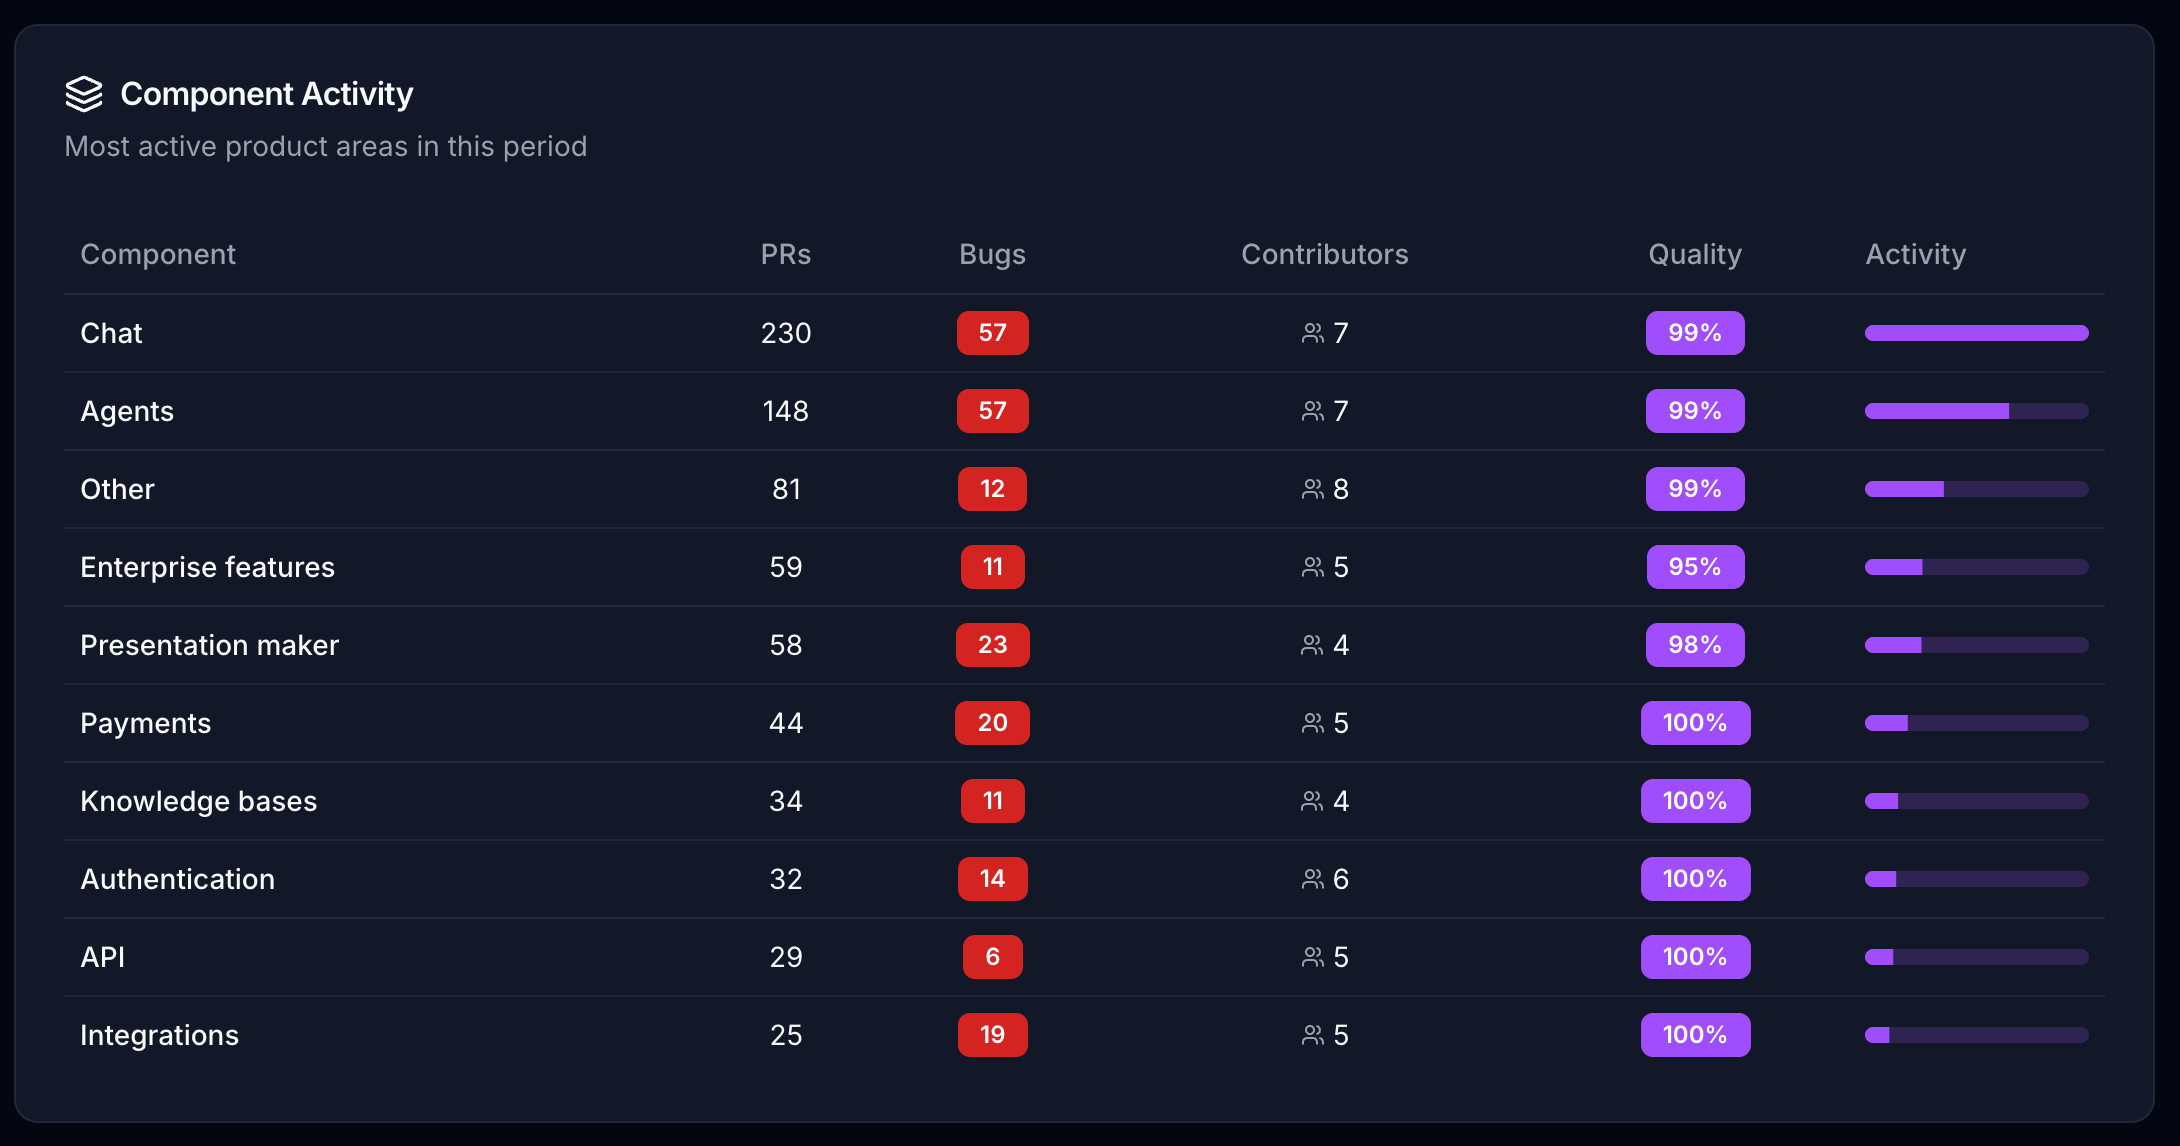
740 pull requests across the ten busiest components, 230 of them bug fixes rather than new work. Chat alone is 230 pull requests, which is what a 2.0x multiplier looks like when it is working. Then payments: 44 pull requests, 20 bugs, a 45% bug rate in the component that touches money.
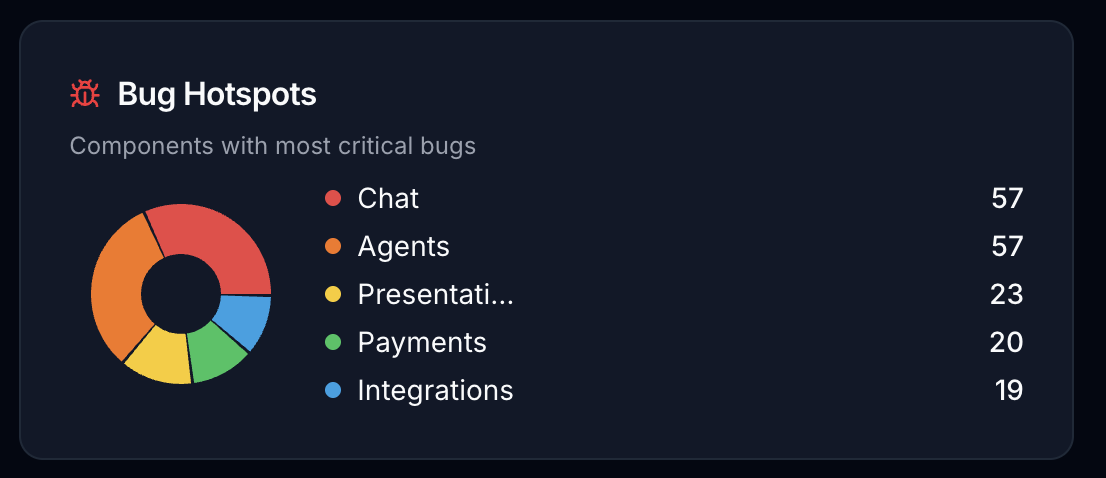
Chat and agents are tied at 57 bugs each, but chat produced those over 230 pull requests and agents over 148. Same bug count, 55% more work behind one of them. That is a signal about agents no retrospective was going to surface, because nobody merged enough of both to notice.
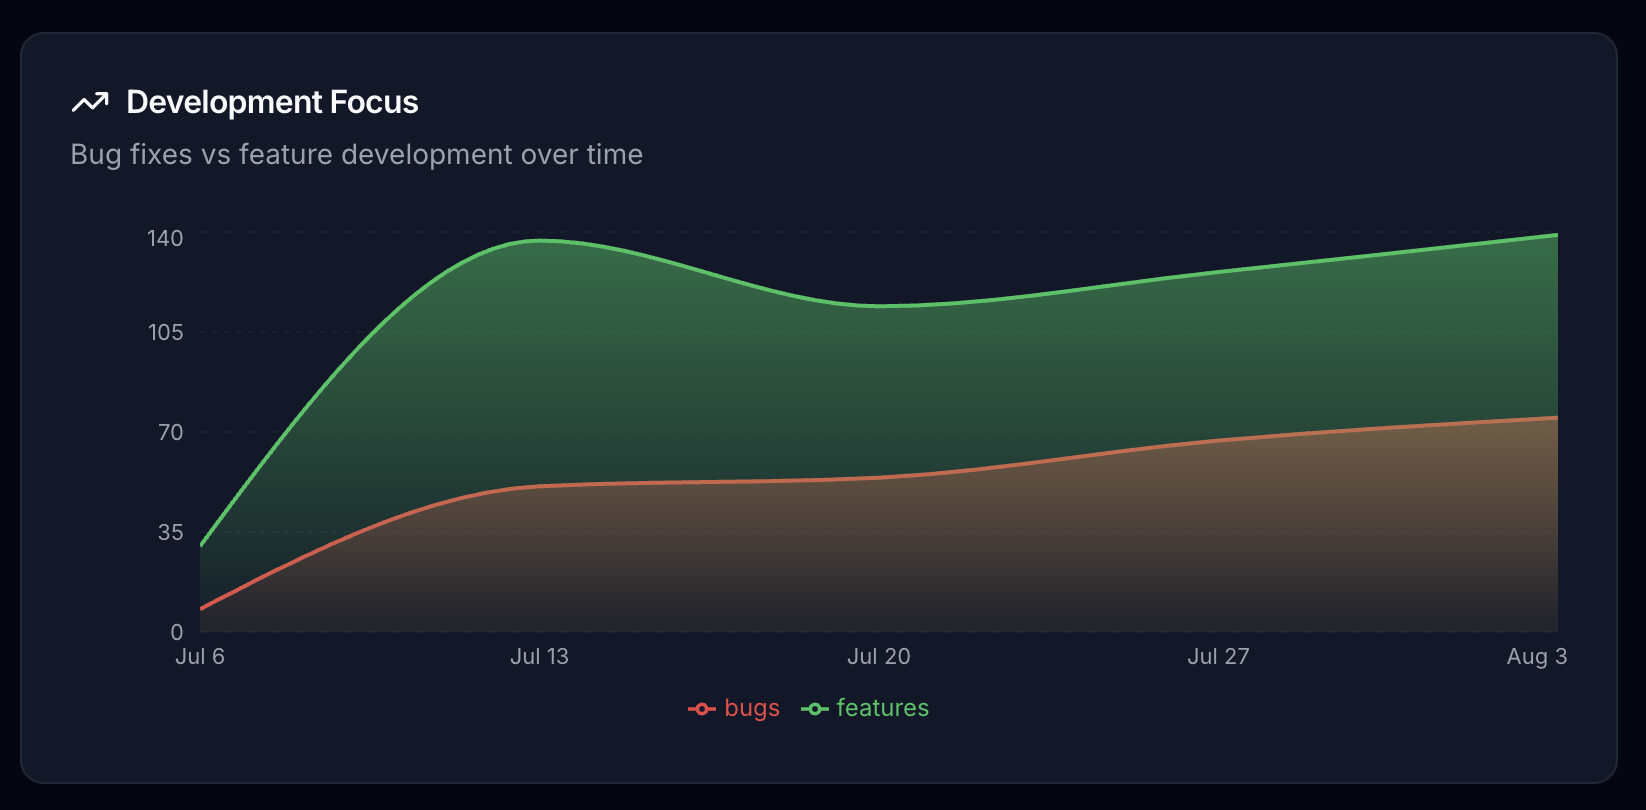
Bugs and features rise together rather than trading off. Five weeks is well inside the noise a single large project landing would produce, so treat that chart as a description of the period and nothing more.
I do not have an uplift number, and you should not trust anyone who does
Here is the claim I would like to make. Since we started publishing this monthly, work has shifted toward the components we marked as important, because engineers want the score.
I am not putting a percentage on it. We turned this on mid-stream. There was no baseline and no control repository, and we never agreed in advance what “shifted” would mean. The multipliers moved during the period. So did headcount. Any number I published would be one I picked after seeing the data, which makes it decoration.
What changed is the argument. People stopped asking whether their work was appreciated and started asking why a component was rated 1.0x. That is a better fight to be having, and it is the one thing I would have paid for on its own.
Our own tool is not clean either, and the sharpest edge is this: a pull request that scores zero does not tell you which eligibility criterion closed on it. Miss the issue link or the tests and the score is zero regardless of severity, and the person with the most to argue about is handed the least to argue with. We are fixing that before anything else on the list.
Point it at the roadmap, then hand people the ruler
Strip the authority off an org chart and what is left underneath is a routing table. It carries “what matters this quarter” outward from the people who decided it, and “who did what” back inward, and it does both slowly and with distortion at every hop. Everything you dislike about corporate politics is a compression artifact of that routing. Managers have been the only available hardware for the job.
They are not the only available hardware now. A model that reads every diff, plus a table of multipliers, does the outward routing in one hop and the inward routing in a query. That is the pull organisation, and I want to be exact about its limits. Nothing gets flattened. Leadership still sets the multipliers, so the strategy is still decided in one room by a few people, and all that changes is the journey out of that room. What is left for humans is the part that was always the job and never had time: deciding what the multipliers should be, and sitting with the people those decisions moved.
The politics do not disappear. They move. They move from “does my manager remember my quarter” to “why is my component rated 1.0x when the roadmap calls it core,” and that second fight is about the company’s actual strategy, conducted in public, in a table anyone can read. I would rather have that fight every month than the current one, held once a year, in private, by someone reconstructing eleven months from memory.
Somebody is going to run this badly. Somebody is going to put a scoreboard on a wall with no eligibility explanations and no override trail and fire the bottom decile, and it will get blamed on the model rather than on the person who chose the multipliers.
So measure me with the same instrument. If you run something like this, publish the multiplier table, so people argue with the strategy rather than with the score. Publish the per-pull-request breakdown, so anyone who scored zero can see which gate closed on them and appeal it. Publish the override log, because a number a human changed by hand is the only number worth auditing. We publish the first. We do the third badly. We do not publish the second at all, and that is the one that decides whether a thing like this is a management tool or just a faster way to be unfair.
GitRank is at gitrank.dev and is licensed CC BY-NC 4.0. Scoring on the production path runs on Claude Haiku 4.5 at temperature 0.3. All figures above come from our own platform repository between 6 July and 3 August 2026, sample size one company and seven developers, which is a description of us and not a benchmark of anything.